An SEO forecast is not a promise about the future. It is a transparent model of assumptions: demand × achievable visibility × CTR × conversion × value, plus time, constraints and a range of uncertainty.
Data and sources as of: September 14, 2026
The worst SEO forecast is a number to two decimal places for 12 months: “we expect 1,284,732 clicks”. It looks precise, but hides the unknowns: rankings, SERP changes, competitor actions, AI answers, seasonality, indexing, release delays.
I forecast not a single number, but a system of scenarios. A forecast is for comparing decisions and capacity planning, not for pretending to control Google.
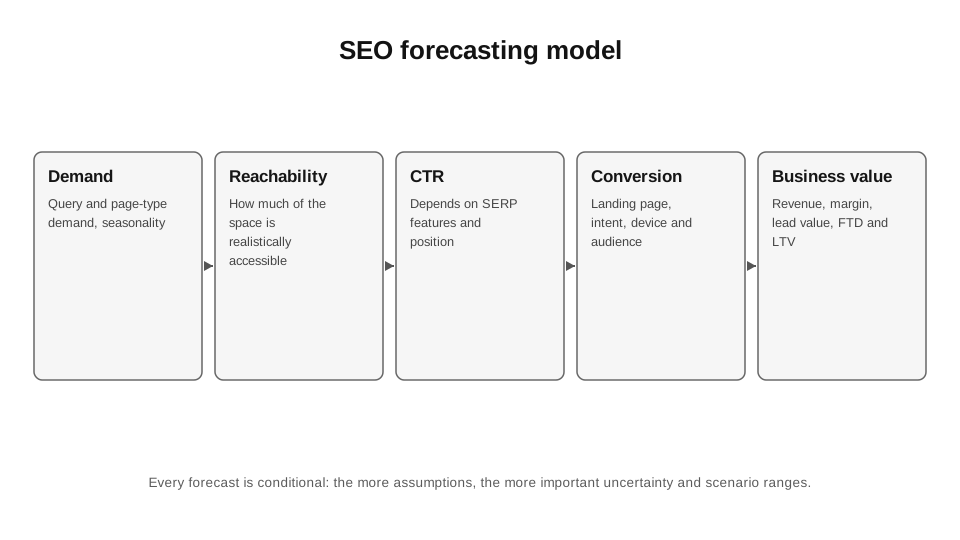
36.1. Forecast unit economics
For a content cluster, I can forecast monthly clicks and conversions. For a technical fix, recovered indexable inventory or avoided loss. For a migration, a risk range. For a link campaign, not “DR +10”, but the expected contribution to target pages, albeit with considerable uncertainty.
The model should match the type of decision. There is no need to force every SEO task to produce a “traffic forecast” if its value lies in reliability or risk reduction.
36.2. Demand baseline
Search volume from a third-party tool is an estimate, not a census. I calibrate it against my own GSC data wherever the site already has impressions. For a new market, I use ranges and seasonality. Google Trends helps establish direction, but does not provide absolute volume.
For a programmatic set, I do not sum the volumes of thousands of keywords without deduplicating intent. One page can rank for hundreds of synonyms; summing keyword volumes overstates addressable demand.
36.3. Ranking/visibility scenarios
Instead of “we will reach the top-3”, I define distributions: low — page 2/a small top-10 share; base — some clusters in the top 5–10; high — a strong top-3 share. For each group, I use my own observed CTR, if available.
A generic CTR curve from a study is a starting point, not the truth. Brand/non-brand, device, rich results, AI Overviews and query intent dramatically change CTR. The best CTR model is your own historical GSC data for similar query classes.
36.4. AI/zero-click adjustment
In 2026, informational visibility may have a lower external CTR because of AI Overviews and other SERP answers. I do not insert a single “AI penalty = 40%” across the entire model. I segment queries by surface/intent and use observed data or a scenario range.
Search usage may rise while click yield falls. Demand growth and traffic growth are therefore different forecast parameters.
36.5. Indexing ramp
For 50,000 new URLs, I do not assume that all are indexed on launch day. The model includes a ramp: generated → discovered → crawled → indexed → impressions. I take the coefficients from a pilot or historical template data.
If the pilot showed 65% indexed after 28d and 80% after 90d, the forecast must reflect that. Otherwise, revenue “from the first month” is simply mathematically impossible.
36.6. Conversion and value
SEO traffic is not homogeneous. Money pages and informational articles have different conversion rates. I forecast at the page type / intent level. For ecommerce, margin is better than gross revenue if the decision concerns budget.
For lead gen, I use the qualified rate and close rate; for affiliate, EPC or registration→FTD, if the data is available. If there is no downstream data, I explicitly show where the model stops.
| Parameter | Low | Base | High |
|---|---|---|---|
| Eligible URLs | 8,000 | 10,000 | 10,000 |
| Index rate 90d | 55% | 75% | 85% |
| Impressions / indexed URL | 120 | 180 | 240 |
| CTR | 2.0% | 3.0% | 4.0% |
| Conversion rate | 1.5% | 2.0% | 2.5% |
| Value / conversion | €35 | €35 | €35 |
36.7. Forecast resource, not only outcome
A project can have high traffic upside and still be a poor decision because of engineering/content cost. I add the required effort: developer days, editorial hours, data engineering, links, design, maintenance.
This makes it possible to compare “10k programmatic pages” with “fix canonical bug” not by excitement, but by expected value / cost / confidence / time-to-impact.
36.8. Time to impact
SEO changes have a lag. A technical fix may have a visible impact after recrawling; content after indexing/re-evaluation; authority is even less deterministic. A forecast with a cumulative curve is more realistic than a flat line.
I show a ramp in months 1–3, scaling in 4–6, and a steady state/decay in 7–12, if that matches the mechanics. If there is no data, the range is wider—not “an average lag of 47 days”.
36.9. Confidence score
Confidence is not a gut feeling of 8/10. I break it down into demand evidence, implementation certainty, indexability, historical analogues, conversion data and the competitive gap. Then I explain why the scenario range is so wide.
A low-confidence forecast can be useful if the upside is large and the test is cheap. It simply must not be sold to the CFO as committed revenue.
36.10. Backtesting
Every quarter, I take old forecasts and compare them with actuals: where we got demand, index rate, CTR, conversion or the timeline wrong. This is the best way to improve the model.
If forecasts are never backtested, the team is not forecasting—it is writing sales documents.
36.11. Do not turn a forecast into a KPI
When a forecast becomes a quota, the team starts massaging assumptions or optimising short-term vanity metrics. KPIs form a performance system; a forecast is a decision model. They are related, but not identical.
I record the assumptions version and change the forecast only when new facts emerge, not to “get the plan back into the green”.
36.12. A simple formula
For a cohort of pages, the basic model may be: `Eligible URLs × Index rate × Impressions per indexed URL × CTR × Conversion rate × Value`. It is crude, but transparent. A more complex model makes sense only when it improves decisions.
It must be possible to replace each factor with actual data after launch. The forecast then gradually becomes an operating model.
Sources for Chapter 36
1. Google Search Central. Debugging traffic drops. https://developers.google.com/search/docs/monitor-debug/debugging-search-traffic-drops — Seasonality, updates, technical issues and demand.
2. Google Search Central. Search Console Performance data. https://developers.google.com/search/blog/2022/10/performance-data-deep-dive — Your own impressions/clicks as calibration data.
3. Search Console Help. Generative AI performance report. https://support.google.com/webmasters/answer/16984139?hl=en — AI exposure as a separate measurement layer.
4. Google Analytics Help. Traffic source dimensions. https://support.google.com/analytics/answer/15612152?hl=uk — Conversion/value segmentation by source and session.