SEO operates in an environment where the site, competitors, demand and Google all change at the same time. That is precisely why “we changed X, and two weeks later traffic grew” is weak evidence of causality.
Data and sources as of: September 14, 2026
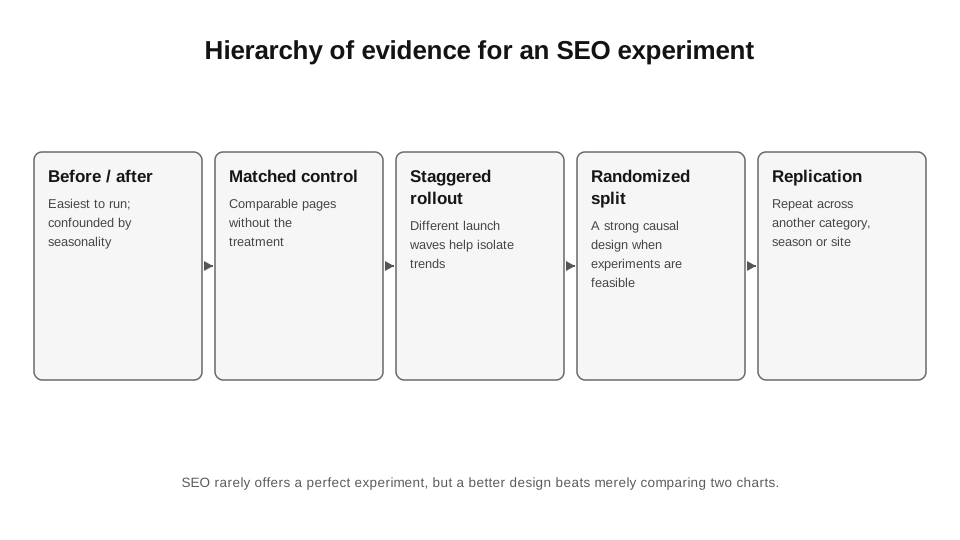
There are few ideal randomised experiments in SEO, but that is no excuse for before-and-after storytelling. We can strengthen the evidence through control groups, matched pages, staggered rollout, difference-in-differences, synthetic controls and Bayesian time-series models.
The goal of an experiment is not to get a green arrow. The goal is to reduce uncertainty enough to make a better rollout decision. A negative or null result saves budget too.
35.1. Hypothesis before data
I write down the hypothesis before launch: change, target metric, expected direction, unit, period, exclusion rules, stop condition. This reduces HARKing—inventing an explanation after seeing the chart.
For example: “Adding contextual links from hub pages to near-orphan product pages will increase impressions/eligible URL over 28 days compared with a matched control, without an increase in 404/redirect crawling.” This is much better than “testing internal links”.
35.2. The experimental unit
Page, template, category, domain, market—these are different units. If you change global navigation, page-level control is practically impossible because the treatment affects the entire graph. If you change the titles of 500 products, you can randomly assign comparable URLs.
You need to account for interference: treating one page can affect another through internal links or cannibalisation. The classic A/B assumption of independence is often violated.
35.3. Randomisation
Randomised controlled experiments are considered the gold standard for causality because random assignment balances known and unknown confounders on average. Microsoft describes controlled experiments as a way to establish causality scientifically in web products.[1]
Randomisation is not always possible in SEO, but for large sets of similar pages, it sometimes is. The key is not to randomise URLs that differ fundamentally in demand, age or category when the sample is small.
35.4. Matched controls
When randomisation is impossible, I select a control based on pre-period metrics: impressions, clicks, average position, page type, age, country, query class. I then check for parallel trends before treatment.
A control should not “look similar” solely based on its URLs. If the treatment group is seasonal and the control is not, the difference after launch will prove nothing.
35.5. Difference-in-differences
The logic is simple: look at how much the treatment group changed from before to after, and subtract the change in the control. If the treatment group is +20% and the control is +15%, the estimated incremental change is close to +5%, not +20%.
This still depends on assumptions, particularly parallel trends. But it is already stronger than attributing the entire +20% to the SEO change.
35.6. CausalImpact / synthetic control
Google Research published a Bayesian structural time-series approach for estimating the causal impact of an intervention when a randomised experiment is impossible.[2] The model builds a counterfactual time series from control predictors and compares the observed post-period with the expected one.
This is not a magic button. If the control variables themselves were affected by the treatment, if a structural break coincides with a Google update, or if the pre-period is short, the model can be convincingly wrong.
35.7. Seasonality and Google updates
Before launch, I record the Search Status Dashboard status, known updates, holidays, promotions and product launches. If a core update starts in the middle of a test, I do not “adjust” the data in Excel. I either continue the test until things stabilise or acknowledge the confounding.
Google recommends waiting at least a full week after a core update finishes before analysing results in Search Console.[3] This is useful discipline for experiments too: do not draw a causal conclusion during rollout.
35.8. Sample size and minimum detectable effect
A small sample may not distinguish +5% from noise. I define the minimum effect that has any business value and build the sample size and test period around it. If detecting +3% CTR requires millions of impressions and the site has 20k, do not promise precision the data cannot deliver.
In SEO, it is often better to aggregate a homogeneous page cohort than to test a single page. But aggregation must not mix different intents and seasonal patterns.
35.9. Multiple testing
If you test 100 changes with p<0.05 and select only the “winners”, some will be down to chance. SEO teams rarely adjust for multiple comparisons because many tests are informal. At a minimum, maintain a registry of all tests, including those with null results.
I do not treat statistical significance as binary magic. I look at effect size, confidence interval/credible interval, business value, consistency and the plausibility of the mechanism.
35.10. Primary and guardrail metrics
The primary metric must match the hypothesis: indexed rate, clicks, conversions, revenue. Guardrails are what must not deteriorate: 404 rate, crawl errors, conversion rate, page speed, returns.
For example, an SEO title test may increase CTR but reduce conversion through overpromising. A CTR winner is not necessarily a business winner.
CODE 35.1. Basic difference-in-differences.
# Simple difference-in-differences on aggregated data.
# CSV: group (treatment/control), period (pre/post), metric
import pandas as pd
df = pd.read_csv("seo_test.csv")
p = df.groupby(["group","period"])["metric"].mean().unstack()
treat_change = p.loc["treatment","post"] - p.loc["treatment","pre"]
control_change = p.loc["control","post"] - p.loc["control","pre"]
did = treat_change - control_change
print(p)
print("Treatment change:", treat_change)
print("Control change:", control_change)
print("Difference-in-differences:", did)
35.11. Rollout after the test
A winner on 10% of pages does not guarantee the same effect on 100%. Different categories, demand distributions and the link graph may change the outcome. I roll out in stages and retain a holdout if the business allows it.
After rollout, I monitor durability: the effect after 7, 28, 90 days. The SEO system may not reassess pages immediately.
35.12. A culture of negative results
If a team publishes only success cases, it learns the wrong lessons. I retain failed/neutral tests with their hypotheses and context. This creates an internal evidence base and reduces repetition of the same ideas.
Sometimes the most valuable result is: “We thought X delivered +15%, but the control showed 0–2%; we will no longer spend a sprint on this.”
| Field | What to write |
|---|---|
| Hypothesis | change → mechanism → metric → direction |
| Unit | URL/template/category/market |
| Treatment | exact diff |
| Control | how it was selected/randomised |
| Pre-period | duration and parallel trend |
| Post-period | duration, lag |
| Primary metric | one main metric |
| Guardrails | what must not deteriorate |
| Confounders | updates, seasonality, releases |
| Result | effect size + uncertainty |
| Decision | rollout / repeat / reject |
Sources for Chapter 35
1. Microsoft Research. Online Experimentation at Microsoft. https://www.microsoft.com/en-us/research/publication/online-experimentation-at-microsoft/ — Controlled experiments and causality.
2. Google Research. Inferring causal impact using Bayesian structural time-series models. https://research.google/pubs/inferring-causal-impact-using-bayesian-structural-time-series-models/ — Quasi-experimental evaluation of an intervention.
3. Google Search Central. Core updates. https://developers.google.com/search/docs/appearance/core-updates — Timing of analysis after rollout.
4. Microsoft Research. Benefits of Controlled Experimentation at Scale. https://www.microsoft.com/en-us/research/publication/the-benefits-of-controlled-experimentation-at-scale/ — A practical culture of experimentation.