How to distinguish impressions, mentions, citations, visits and conversions, avoid mixing Google data with modelled estimates from third-party services, and build reporting that does not create a false sense of precision
Data and sources as of: September 12, 2026
The problem with modern SEO analytics is no longer a lack of metrics. There are now too many. Rankings, impressions, clicks, generative impressions, citations, brand mentions, share of voice in AI answers, visits from ChatGPT, assisted conversions, branded search, direct traffic. Every tool adds its own index, and in a dashboard all of this can easily become one attractive number that means nothing specific.
In this chapter, I deliberately avoid looking for one primary AI visibility metric. There is none. There are several distinct events that occur at different stages of the user journey and are measured by different sources. If a team does not distinguish these events, it starts comparing Google impressions with Bing citations, mentions from a third-party monitoring system with real GA4 sessions, and estimated share of presence with actual market demand. At the Senior SEO or SEO Lead level, this is no longer a measurement error. It is a modelling error.
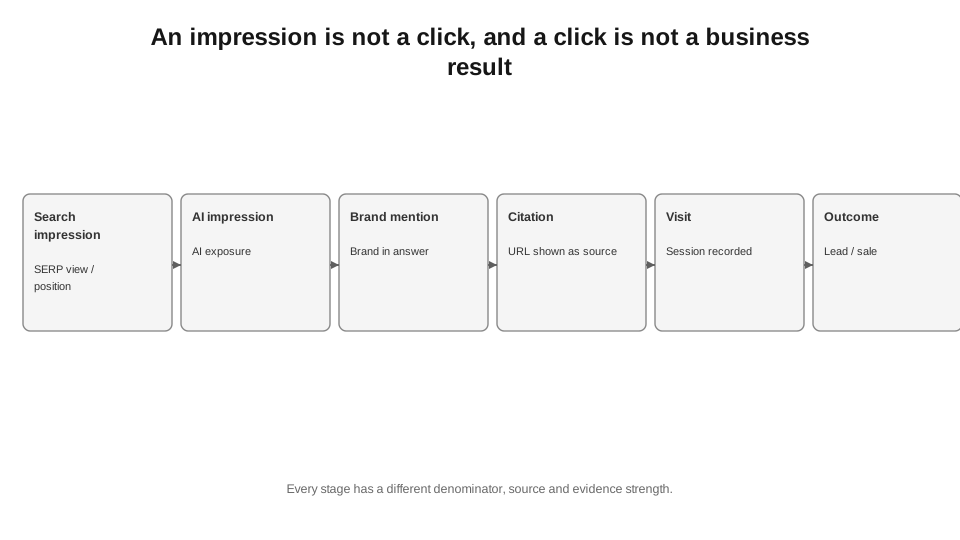
4.1. Define the event first, then the metric
Traditional organic analytics was relatively convenient because the main events formed a clear chain: SERP impression -> click -> session -> conversion. Even here, there were problems with aggregation, attribution and differences between Search Console and site analytics, but at least the events themselves were clear.
Generative search adds several events before the click. A page may appear in an AI Overview. A brand may be named in the text without a link. A URL may be cited as a source. A document may be found by the system but receive no visible citation. After the answer, a user may not click at all, but perform a branded search a day later. All these scenarios have different economic implications.
| Event | What actually happened | What can NOT be automatically claimed |
|---|---|---|
| Impression in classic Search | A site link received an impression under Search Console rules | That the user read or remembered it. |
| Impression in a Google generative feature | A site link was shown in an AI Overview or AI Mode | That there was a click, a citation in a third-party LLM or an impact on the brand. |
| Brand mention | The brand name appeared in the model’s answer | That the model used the brand’s site as a source. |
| URL citation | The page was shown as a source in an AI answer | That the user opened the URL or that the citation was first / most prominent. |
| Visit | The user opened the site from a specific source | That this channel was the sole reason for the decision. |
| Conversion | A defined business action took place | That the last channel before conversion created all the demand. |
4.2. No tool sees the entire journey
In 2026, the safest measurement architecture is not to look for one service that “measures AI”, but to stitch together several layers of data. A search engine sees its own impressions and some interactions. Web analytics sees actual visits after a click. A CRM sees a sale or a lead. A third-party monitoring system sees only the set of prompts and answers it has checked itself.
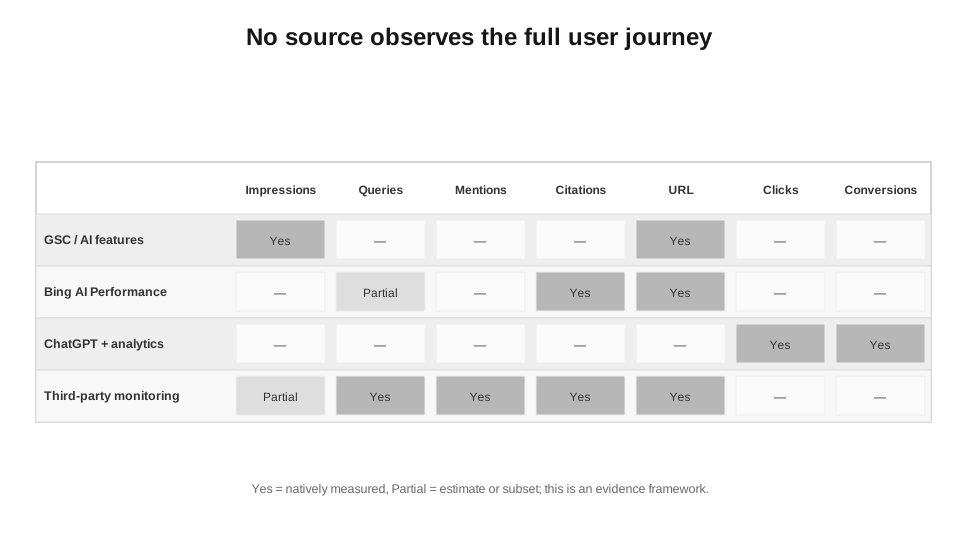
Google: official Search Console documentation. Bing: the official description of the AI Performance report. ChatGPT: official UTM tagging of visits. Third-party monitoring system: sampled prompt checks, not access to users’ private sessions.
This is a fundamental boundary. A third-party tool does not have access to all private conversations in ChatGPT, Gemini or Perplexity. Ahrefs explicitly describes Brand Radar as a sampling approach: the service runs large sets of prompts and records the answers, but does not see every actual brand mention across all user sessions.[6] That is precisely why a third-party service’s “AI visibility” is an index or a structured sample, not a population census.
Conversely, Google Search Console has first-party platform data about Google, but does not show ChatGPT, Copilot or Perplexity. Bing Webmaster Tools shows its own ecosystem and some partner integrations, but is not a global AI analytics hub. GA4 will see a click from ChatGPT, but will not see ten ChatGPT answers that mentioned your brand without a visit.
4.3. Google Search Console: a dedicated dimension of generative visibility for the first time
On June 3, 2026, Google announced dedicated reports on generative AI in Search, and on August 31 it announced their global rollout to all sites. The dedicated report covers AI Overviews and AI Mode and specifically shows impressions - how many times links to a site were shown to a user in a generative feature of Google Search.[1][2]
The report provides page, country, date and device dimensions. Page data is primarily attributed to the canonical URL. The chart is aggregated at the property level, while the table changes its aggregation depending on the selected dimension. The standard Search Console table limit of 1,000 rows also applies to this report.[2]
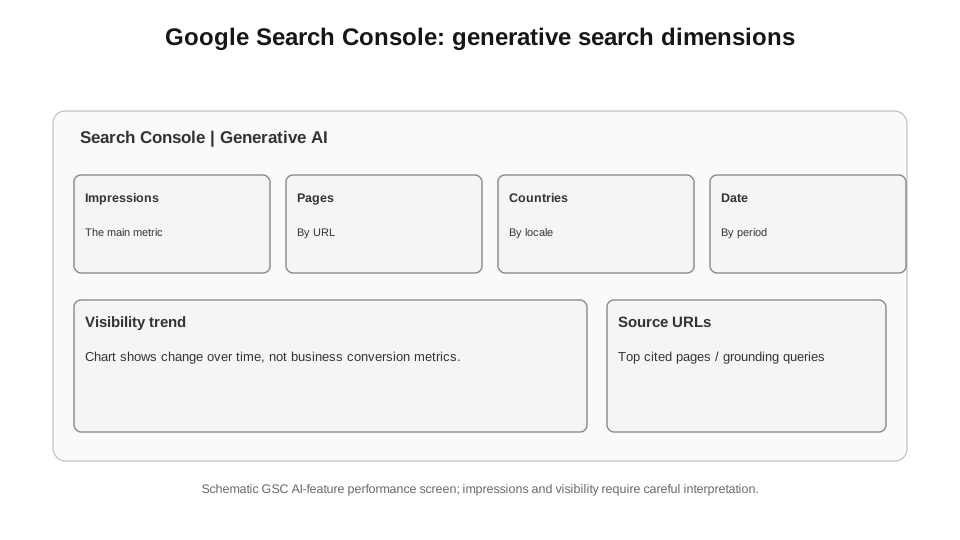
Schematic representation. Source for the functionality: Google Search Console Help, Generative AI performance report (Search).
The most important point here is not that Google finally shows AI impressions. It is what the dedicated report does not show. As of the snapshot date, it has no separate clicks, CTR, average position or query dimension. In other words, we can see that /guide/seo-audit/ receives generative impressions, but we cannot use this report to determine which specific queries generated those impressions or how many visits came specifically from AI Overview or AI Mode.[2]
Meanwhile, AI Overviews and AI Mode are included in the standard Performance report. Google separately explains that a click on an external link in AI Mode or AI Overview counts as a click, while impressions and position follow the standard Search Console rules. For AI Overview, all links in the block receive the same position as the block itself; a follow-up question in AI Mode counts as a new query.[3] This matters because total clicks and impressions already include AI events, but the dedicated generative report provides only a separate view of impressions.
4.4. A useful GSC metric: the share of generative impressions, but with the right name
Google's dedicated report already makes it possible to build a simple operational metric: the share of generative impressions among all web search impressions for the same property, period, country and device. I call it the share of generative exposure, not the “share of AI queries.”
Formula 4.1. This is a ratio of impressions for your property, not an estimate of the share of all Google queries.
For example, if generative impressions are growing while total impressions remain stable, this means that a larger share of your visibility is occurring within Google's generative features. This does not yet tell us whether that is good or bad. Next, you need to look at CTR in the standard Performance report, pages, countries, devices and business outcomes. But you can already see a structural shift in the type of visibility.
4.5. Bing Webmaster Tools provides another piece of the system: citations and grounding queries
On February 10, 2026, Microsoft launched the public preview of the AI Performance report in Bing Webmaster Tools. According to the official description, the report covers Microsoft Copilot, AI summaries in Bing and some partner integrations. Unlike Google, Bing focuses this report on citation activity rather than impressions.[4]
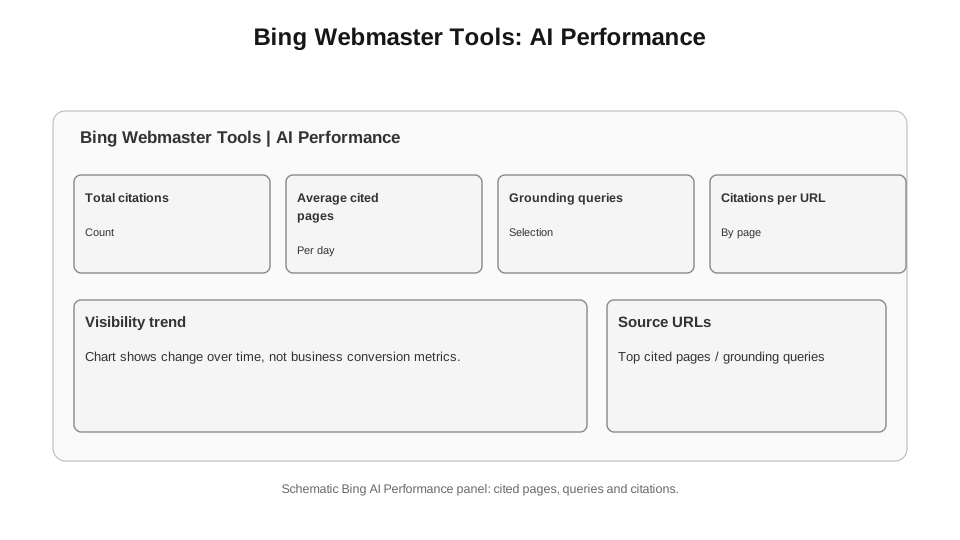
Schematic representation of Microsoft's officially documented metrics, not a screenshot of an actual property.
The “Total Citations” metric (Total Citations) shows the number of times a site was cited as a source in AI answers. “Average Cited Pages” (Average Cited Pages) shows the average number of unique site pages cited per day. “Page-level citation activity” (Page-level citation activity) breaks down citation counts by URL. “Grounding queries” (Grounding queries) shows the key phrases AI used when retrieving content that was subsequently cited.[4]
The last metric is particularly useful, but it is easy to overestimate. Microsoft explicitly states that the “Grounding queries” data in the report is a sample of total citation activity - a sample, not a complete log of all the system's internal queries. Likewise, the Total Citations metric does not show where or how a citation appears within a specific answer, and Average Cited Pages is not a measure of authority or ranking.[4]
4.6. ChatGPT: actual visits can be measured better than mentions without clicks
For ChatGPT, the situation is reversed. OpenAI does not provide webmasters with a Search Console covering all impressions or mentions. But for visits, there is a very clear signal: OpenAI officially states that ChatGPT automatically adds the parameter utm_source=chatgpt.com to outbound URLs. Publishers can track these visits in Google Analytics or other analytics tools.[5]
This means that a session from ChatGPT is a much firmer fact than a third-party service’s “estimated visibility in ChatGPT”. We know that someone clicked a link and arrived on the site. We can then compare landing pages, engaged sessions, CVR, revenue, lead quality and repeat visits. But even here, the UTM parameter does not show how many times the brand was mentioned without a click, or how many ChatGPT answers contained a citation that the user did not open.
NO CODE: AI PROMPT
I will upload a CSV from GA4 containing the date, landing page + query string, sessions and, if available, key events or revenue. Check the columns. Filter landing URLs containing utm_source=chatgpt.com, calculate sessions by date and landing page, as well as conversions and revenue if those fields are present. Do not equate this traffic with all brand mentions in ChatGPT: these are only recorded visits.
ALTERNATIVE WITHOUT AI
In GA4 Explorations, add the Landing page + query string dimension, the Sessions and Key events metrics, and the filter contains "utm_source=chatgpt.com". For recurring automation, use the BigQuery query below.
QR: CODE
Scan with your camera: the QR code contains a compact executable version of the code without comments. The commented code is provided below.
FOR AUTOMATION: SQL FOR GA4 BIGQUERY
Code 4.1. A minimal way to isolate ChatGPT visits using the official UTM parameter. For a production report, I would then deduplicate the first event on the landing page and join conversions and revenue at the session ID level.
-- Task: Count GA4 sessions that started with the URL,
-- where OpenAI added utm_source=chatgpt.com.
-- Replace PROJECT.analytics_XXXXXXXXX with your GA4 BigQuery dataset.
WITH starts AS (
 SELECT
 PARSE_DATE('%Y%m%d', event_date) AS date,
 user_pseudo_id,
 -- Session ID from event_params.
 (SELECT value.int_value
 FROM UNNEST(event_params)
 WHERE key = 'ga_session_id') AS ga_session_id,
 -- Full URL of the page the user came to.
 (SELECT value.string_value
 FROM UNNEST(event_params)
 WHERE key = 'page_location') AS page_location
 FROM `PROJECT.analytics_XXXXXXXXX.events_*`
 WHERE event_name IN ('session_start','page_view')
)
SELECT
 date,
 -- We count unique sessions, not the number of events.
 COUNT(DISTINCT CONCAT(
 user_pseudo_id, '-', CAST(ga_session_id AS STRING)
 )) AS sessions
FROM startsWHERE REGEXP_CONTAINS(
 page_location,
 r'(?i)[?&]utm_source=chatgpt\.com(?:&|$)'
)
GROUP BY date
ORDER BY date;
4.7. A mention and a citation are not the same thing
In third-party monitoring, I always distinguish between a mention and a citation. A mention means that the brand appears in the text of an AI answer. A citation means that a domain or a specific page is shown as a source. Ahrefs separates its metrics in exactly this way: one mention is counted if the brand appears at least once in an answer, and one citation if a page or domain is cited at least once.[7]
This produces four distinct practical scenarios. A brand may be mentioned and cited. It may be mentioned without a citation, for example as a well-known product. A site may be cited without an explicit brand mention in the main text. Or it may not appear at all. If we reduce everything to a single index, we lose the diagnosis.
| Scenario | What we see | Probable task |
|---|---|---|
| Mention + citation of your own URL | The brand is present, and the site is used as a source | Scale up topics and URLs where you already have a strong presence. |
| Mention without citation | The model knows the brand, but another site serves as the source | Check third-party sources, PR, review pages and your own coverage of the topic. |
| Citation without an explicit brand mention | The page serves as a source of facts | Strengthen the brand connection, authorship, product identity and conversion path. |
| Neither mention nor citation | The brand is absent from the sample | Check the relevance of the prompt set, topic coverage, authority and competitors’ sources. |
4.8. Third-party AI metrics are useful if you do not present a sample as the complete record of actual usage
A third-party monitoring system is needed where the platform itself does not provide enough data. It can consistently test the same set of prompts, recording answers, citations, mentions, competitors and sources. This is very useful for analysing trends. The problem begins when the resulting index is called “the actual share of presence across all ChatGPT users”.
As of August 2026, Ahrefs reports 459+ million prompts across six AI indexes. The largest segment is AI Overviews, with 308.6 million; the separate Gemini, Perplexity, ChatGPT and Copilot indexes have around 31 million prompts each, and AI Mode has 25.3 million.[8] This is a very large sample, but it is still a constructed index, not private logs of actual platform usage.
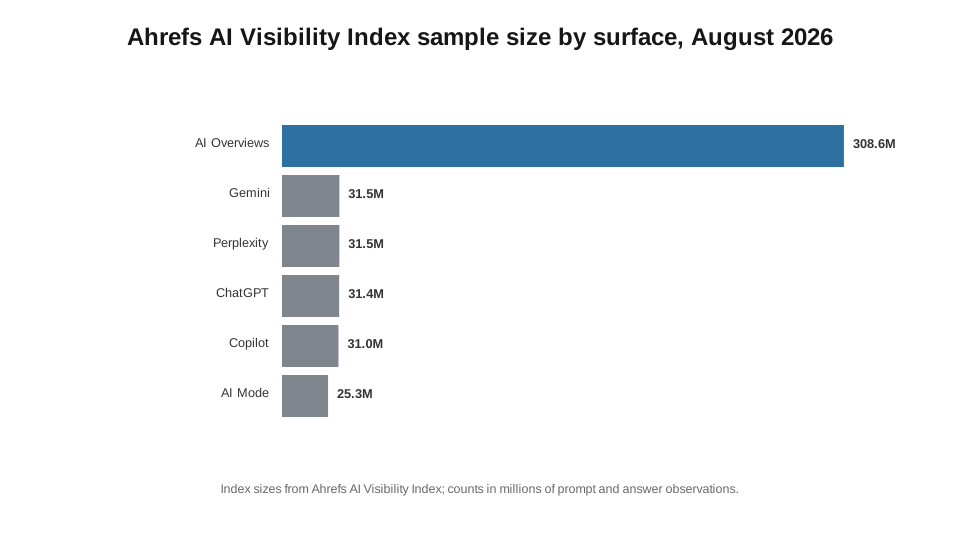
Ahrefs models prompts from actual search demand and People Also Ask. A large sample size does not turn it into a complete log of all user interactions with LLMs.
Reading the metric definitions is even more important. Ahrefs’ Estimated Impressions metric is not a measure of actual impressions on the ChatGPT platform itself. The service estimates them using the search volume of related Google / People Also Ask queries; AI share of voice is the relative share of these estimated impressions among tracked brands.[7] Semrush uses a different system: AI Visibility as a comparative index from 0-100, mentions, estimated monthly audience, citations and other proprietary metrics.[9] So a value of 37 in one service cannot be compared with 37 in another.
| Metric | Working definition for the book | Correct denominator |
|---|---|---|
| Mention frequency | Share of tested answers in which the brand is mentioned at least once | Number of answers in the fixed prompt sample. |
| Citation frequency | Share of tested answers in which the domain / URL is cited | Number of answers in the same sample. |
| Citation-to-mention ratio | How many answers mentioning the brand also cite our domain | Number of answers mentioning the brand. |
| AI share of voice | Share of brand mentions / citations relative to a defined set of competitors | Only the specific prompt set, platform, country, date and competitor list. |
| CVR of AI referrals | Conversions from identified AI sessions / AI sessions | Actual referral sessions in your own analytics. |
| Revenue per AI session | Revenue from AI referrals / AI sessions | Actual sessions, not estimated impressions. |
4.9. The most dangerous mistake - a denominator that changes unnoticed
In traditional rank tracking, we are used to a relatively stable keyword set. In AI monitoring, the prompt set can change much more substantially: a service adds new queries, changes how it builds the prompt set, connects a different model, changes the geography or updates the competitors. After this, share of presence can change even without any real change in brand presence.
For my own monitoring, I therefore record at least five things: the exact prompt text or its stable identifier, the platform and model, the country or language, the check date and the competitor list. If a service supports daily monitoring of custom prompts, that history must not be mixed with a prebuilt index without a separate label. These are different samples.
4.10. How I distinguish sources by evidential weight
Not all data is equally close to revenue. If the CRM shows 120 paid contracts, that is a stronger business fact than 18,000 estimated AI impressions from a third-party service. This does not mean impressions are unnecessary. They are needed for early diagnosis. But managing a budget using only the top layer is dangerous.
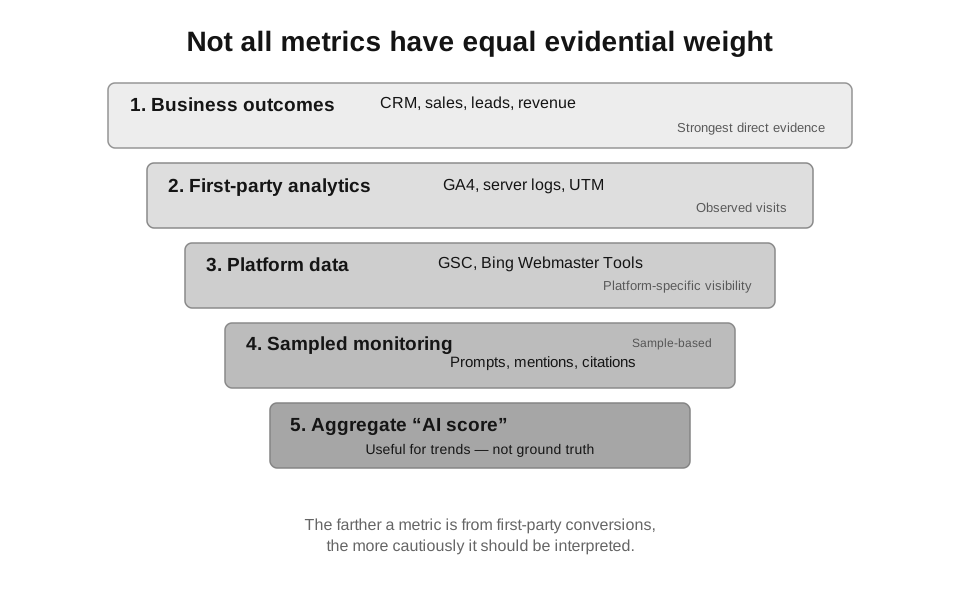
This leads to a practical principle: in a report to management, I do not place an “AI visibility index” above leads, revenue and actual visits. But for the SEO team, citation frequency or share of generative impressions can be an early indicator that reveals changes before they reach revenue. A good system does not discard weaker signals. It simply does not confuse their evidential weight.
4.11. Visibility without the click and brand: measurement is possible, causality is harder to prove
The most difficult area begins when a user sees a brand in an AI answer, does not click and then arrives through another route. Standard web analytics has no event for that first contact, so conversion attribution may go to branded organic traffic, direct traffic, paid search or even email. This is not an analytics bug. The event genuinely does not occur on your site.
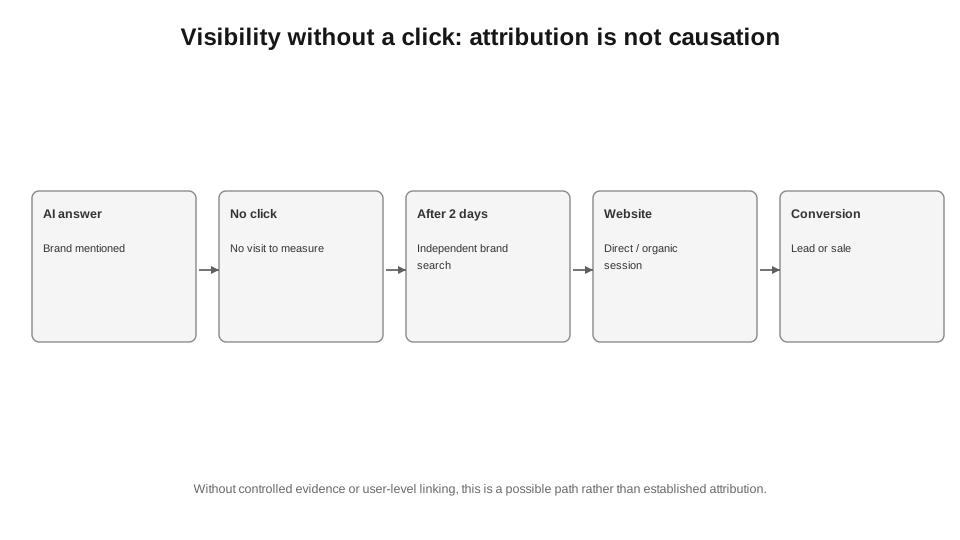
What can be done in practice. First - examine demand for branded queries in Search Console and trends in direct and branded organic traffic alongside changes in AI visibility, but treat this as correlation. Second - use control markets, geographies or time windows if the business allows a natural experiment. Third - for lead generation, ask how users first heard about you in the CRM or a form, but do not force them to choose only one channel. Fourth - examine assisted conversions and path data, understanding that visibility without a click through to the site will still not appear there.
If branded queries grew by 20% after AI mentions increased, that is not yet proof that one caused the other. There may have been a PR campaign, advertising, seasonality or a product release at the same time. In this book, I deliberately do not turn this appealing story into a causal fact without a control.
4.12. A minimum reporting dashboard for a Senior SEO in 2026
My basic reporting dashboard now has not a single “Organic traffic” chart but at least four layers. The first is demand and classic Search. The second is generative visibility in the platform’s own data sources. The third is sampled presence on third-party AI platforms. The fourth is actual sessions and business outcomes.
| Layer | Minimum KPIs | Slices | Frequency |
|---|---|---|---|
| Classic Search | Clicks, impressions, CTR, average position, branded / non-branded queries | Page, cluster, country, device | Weekly + 28d/YoY |
| Google Generative Search | Generative impressions, share of generative exposure | Page, country, device, date | Weekly |
| Bing AI | Citations, cited URLs, sample of grounding queries | URL, topic, date | Weekly / monthly |
| LLM monitoring | Mention frequency, citation frequency, share of voice across a fixed prompt set | Platform, geography, topic, competitor | Weekly or monthly |
| Visits from AI platforms | Sessions, engaged sessions, CVR, revenue / lead quality | Source, landing page, device, country | Weekly |
| Business outcomes | Leads, sales, revenue, margin, CAC / EPC where appropriate | Product, market, funnel stage | Weekly / monthly |
The key rule for comparisons: consistent granularity. Do not compare daily monitoring of custom prompts with a monthly index. Do not compare URL-level generative impressions with a property-level aggregate metric without checking the aggregation. Do not mix US data with global data. Do not draw a conclusion from a single day if the platform and model show high response variability.
4.13. Three types of dashboard errors I see most often
| Error | What it looks like | Why it’s dangerous | How to fix |
|---|---|---|---|
| False CTR for generative features | Total GSC clicks / generative impressions | Different sets of events in the numerator and denominator | Do not calculate it until separate click data or a reliable event-level source becomes available. |
| An AI index as absolute truth | “Visibility index = 62/100, so we have 62% market share” | The index depends on the service’s methodology | Show trends and methodology; alongside them - mentions / citations and prompt coverage. |
| Adding up different platforms | Google impressions + Bing citations + ChatGPT mentions = “total visibility” | The units of measurement are not additive | Keep dashboard metrics separate; combine them only through a normalised index with an explicit formula. |
| No business layer | The report ends with citations | No answer as to whether value is being created | Add referral sessions, conversions, revenue / leads and quality. |
| A shifting prompt set | Prompts are added every month, but the trend is read as pure growth | The denominator changes | Fix the core prompt set and maintain a separate experimental / exploratory set. |
4.14. How to build your own prompt set without turning it into metrics theatre
When I define a prompt set for monitoring, I do not start by asking “which phrases will make AI say our brand name”. That creates a self-confirming benchmark. I start with the real query space: Search Console, conversations with sales, support requests, People Also Ask, internal search, product requests and competitive comparisons. Then I group prompts by user task, not by where the brand is already winning.
| Prompt Class | Example structure | Why track |
|---|---|---|
| Category | “Which services / products are best for X?” | Whether the brand appears in the broad initial commercial consideration set. |
| Comparison | “X versus Y for task Z” | Competitive position and arguments. |
| Problem | “How do I solve problem X?” | Whether the brand / content enters the set of possible solutions before a direct product query. |
| Evidence | “Which sources / data support X?” | Visibility through citations for research, statistics and expert content. |
| Transactional | “What should I choose / buy / book under conditions X?” | The segment closest to a business outcome. |
| Branded | “Is brand X reliable? What are the alternatives?” | Narrative, sentiment, competitors and sources shaping reputation. |
I keep the core set stable for trend tracking. New prompts go into the exploratory set and do not affect the main time series until a new baseline has been established. This is a simple way to avoid manufacturing growth or decline just because the questions have changed.
4.15. Operating standard: what to check weekly and what to check monthly
| Rhythm | What We Check | What Solution Supports This |
|---|---|---|
| Weekly | GSC generative impressions for core URLs; Bing citations; AI referral sessions; mention / citation anomalies in the core prompt set | Whether visibility has broken down, a new opportunity has emerged or rapid diagnosis is needed. |
| Every 28 days | Share of generative impressions; classic Search versus AI trends; prompt coverage by topic; citation concentration by page; referral CVR | Whether there is a structural shift rather than daily noise. |
| Monthly | Competitive share of presence within a stable sample; branded query demand; assisted conversions; business outcomes | Content prioritisation, PR, link acquisition, budget. |
| Quarterly | Review of the core prompt set, data sources, index methodologies and platform list | Whether the measurement system itself has become outdated following changes to products and models. |
4.16. What we know for certain and what we still cannot measure properly
As of September 12, 2026, we can definitively measure separate generative impressions in Google Search Console for AI Overviews and AI Mode.[1][2] We can obtain citation data and a sample of grounding queries in Bing Webmaster Tools.[4] We can reliably isolate referrals from ChatGPT because OpenAI automatically adds utm_source=chatgpt.com.[5] We can run a stable prompt set in third-party trackers and count mentions, citations and competitive presence, provided we remember that this is a sample.[6][7]
We do not have a universal platform-provided counter of all brand mentions across all private LLM sessions. We do not have a single standard for AI share of voice across different services. We cannot calculate the exact CTR of generative features from the separate GSC generative AI report, because the report does not contain separate click data. We cannot prove that an increase in branded search following growth in AI mentions was caused specifically by AI without a controlled study design.
That is why proper reporting in 2026 does not try to hide the gaps. It shows them. For me, a strong dashboard is not one with a single magic number. It is one that makes clear which events are measured using the platform’s own data, which are reconstructed through first-party analytics, which come from a sample and where we have only a working hypothesis.
This concludes Part I. Next, we move from interfaces and measurement to the mechanics of the search engine itself. We will start with the very first question, one that is often overlooked: how a search engine learns that a URL exists in the first place.
Chapter sources
1. Google Search Central Blog. Introducing Search Generative AI performance reports in Search Console. https://developers.google.com/search/blog/2026/06/gen-ai-performance-reports Announced June 3, 2026; global rollout August 31; impressions, pages, countries, devices, dates.
2. Google Search Console Help. Generative AI performance report (Search). https://support.google.com/webmasters/answer/16984139?hl=en AI Overviews and AI Mode; separate generative impressions; pages, countries, dates, devices; aggregation, 1,000 rows, export button.
3. Google Search Console Help. What are impressions, position, and clicks? https://support.google.com/webmasters/answer/7042828?hl=en Rules for AI Mode and AI Overviews: click, impression, position, follow-up query.
4. Microsoft Bing Webmaster Blog. Introducing AI Performance in Bing Webmaster Tools Public Preview. https://blogs.bing.com/webmaster/February-2026/Introducing-AI-Performance-in-Bing-Webmaster-Tools-Public-Preview Total Citations, Average Cited Pages, grounding queries sample, page-level citation activity, trends.
5. OpenAI Help Center. Publishers and Developers FAQ. https://help.openai.com/uk-ua/articles/12627856-publishers-and-developers-faq OpenAI confirms automatic utm_source=chatgpt.com tagging for clicks from ChatGPT search results.
6. Ahrefs FAQ. AI Visibility & Brand Radar. https://ahrefs.com/faq Explicit caveat: AI visibility monitoring is sampling-based, not real-time, and has no access to private conversations or internal OpenAI data.
7. Ahrefs Help Center. AI Visibility Metrics. https://help.ahrefs.com/en/articles/15501968-ai-visibility-metrics Definitions of Mentions, Citations, Found in, Estimated Impressions and AI Share of Voice; a method for estimating impressions using Google search volume.
8. Ahrefs. AI Visibility Index. https://ahrefs.com/ai-visibility-index 459+ million prompts across six indexes; prompt counts for AI Overviews, Gemini, Perplexity, ChatGPT, Copilot and AI Mode; August 2026.
9. Semrush Knowledge Base. AI Visibility Metrics. https://www.semrush.com/kb/1594-ai-seo-metrics AI Visibility 0-100, Mentions, Monthly Audience, Citations, Share of Voice and other proprietary metrics. Used to demonstrate differences in methodologies.
10. Google Search Central Community. Generative AI report data / BigQuery export. https://support.google.com/webmasters/thread/464075295/google-search-console-data-under-the-generative-ai?hl=en As of September 1, 2026, the community was confirming that there was no separate bulk export of this report to BigQuery; Export was available. This is a community source, not formal product documentation.