Why a high ranking no longer guarantees a click, how to distinguish falling demand from CTR compression, and which metrics make sense when some searches end directly in the results
Data and sources as of: September 12, 2026
The click has become a scarcer resource. This does not mean organic search has stopped working. It means the old logic of “higher rankings -> more clicks -> better business outcomes” has become incomplete. In 2026, many more layers stand between a URL’s ranking and a click: AI Overview, answers without a click, local packs, product blocks, video, knowledge panels, follow-up queries, repeat searches and an increasing number of tasks users complete before ever opening a site.
For SEO, this is an unwelcome change, but not simply because there are fewer clicks. The real problem is something else: a drop in CTR is easy to mistake for a ranking decline, a content problem or a Google update. If the diagnosis is wrong, the team starts rewriting pages, building links or changing templates when the real cause lies in the SERP. That is why I treat zero-click not as a marketing term, but as a distinct measurement layer between visibility and a session.
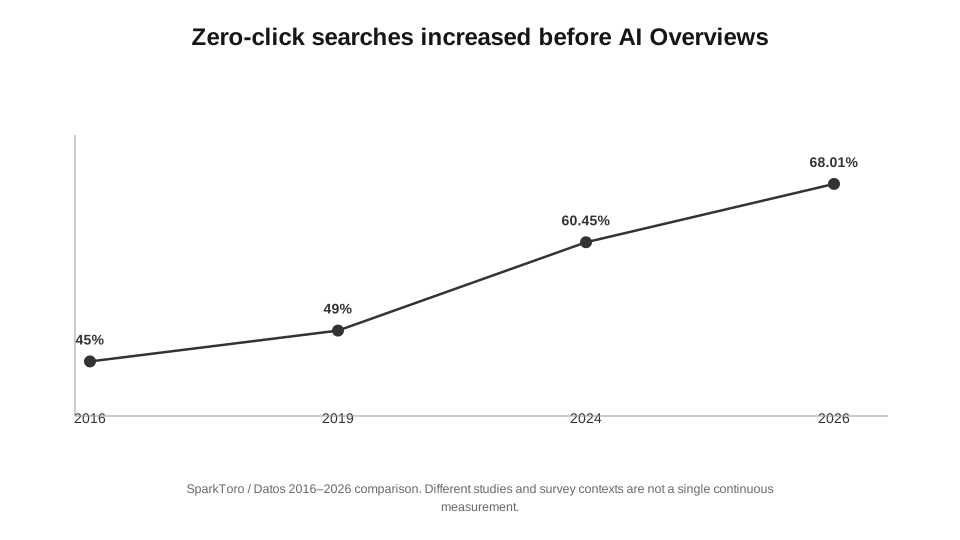
3.1. Zero-click began long before AI Overviews
Zero-click search is not an invention of generative AI. For years, Google has handled some informational tasks without a click through to a site: weather forecasts, exchange rates, calculators, sports scores, time, definitions, local packs, knowledge panels and featured snippets. AI Overview dramatically expanded the range of questions that can be answered this way, but the mechanism itself has been around for a long time.
That is precisely why I do not use the formula “AI took away X% of organic traffic” without a controlled study design. In most real-world data, query type, SERP composition, AI Overview frequency, ads, search intent, device and user behaviour all change simultaneously. We can measure association and direction. It is much harder to prove what proportion of the loss was caused by one specific element.
3.2. First, we need to agree on exactly what we mean by “zero-click search”
In SEO, zero-click is often used as though it were a single universal metric. In reality, the term may encompass at least five different events. If they are mixed together, two studies reporting the same figure may be measuring different things.
| Event | What happened | Why it's not the same |
|---|---|---|
| Search without any click | The user did not open an organic result, an ad or a Google property | The strictest definition. This is how SparkToro describes zero-click in its 2026 study. |
| No click to the open web | The click may have gone to Maps, YouTube or another Alphabet property | For a publisher, this also means losing an outbound visit, but technically a click did occur. |
| No organic click | The user may have clicked an ad or a product block | Bad for organic traffic, but not zero-click in the literal sense. |
| AI answer without a click | The user read the answer or saw the brand but did not open the source | There is visibility and potential influence, but no direct session. |
| Delayed visit | After seeing the answer, the user later searches for the brand, visits directly or converts through another channel | In last-click analytics, the influence of search may disappear. |
In 2026, SparkToro defined zero-click as a search that was not followed by any click on the results. This includes two scenarios: the user ends the session or launches a new search through the standard Google search box. A click on YouTube, Maps, an ad or an organic URL takes the search out of the zero-click category.[1]
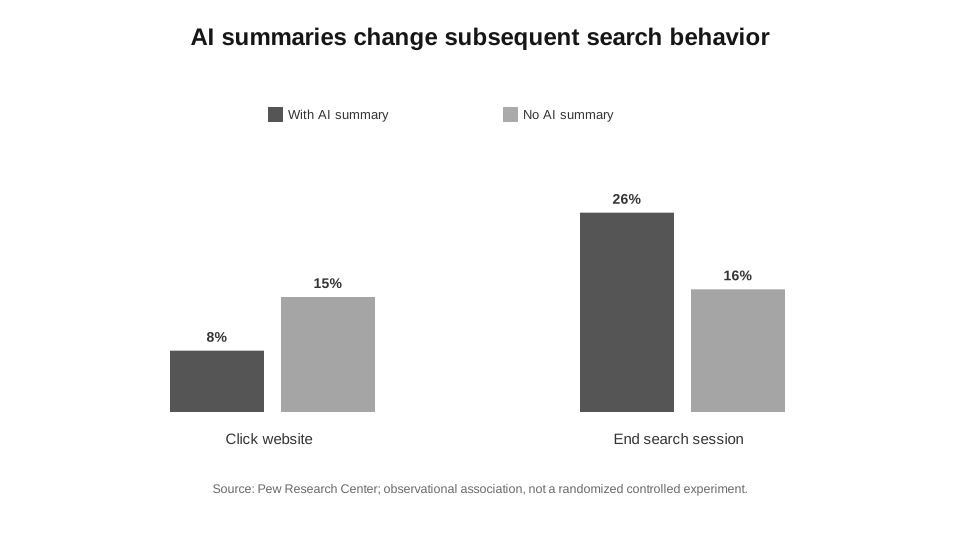
Pew Research Center used a different behavioural framework. For each Google page visited, they examined the next URL event: a click on a standard result, a click on an AI summary, a new search, navigation elsewhere or the end of the browser session. Their 8%, 15% or 26% therefore cannot be plugged directly into the same formula as SparkToro’s 68.01%.[4]
3.3. What actually happens after a Google search in 2026
For the US in January–April 2026, SparkToro and Similarweb found a fairly clear picture. Approximately 32% of searches ended with at least one click. Around 39% ended the session itself, while another 29% led to a new search. Together, these last two groups account for around 68% of searches without a click.[1]
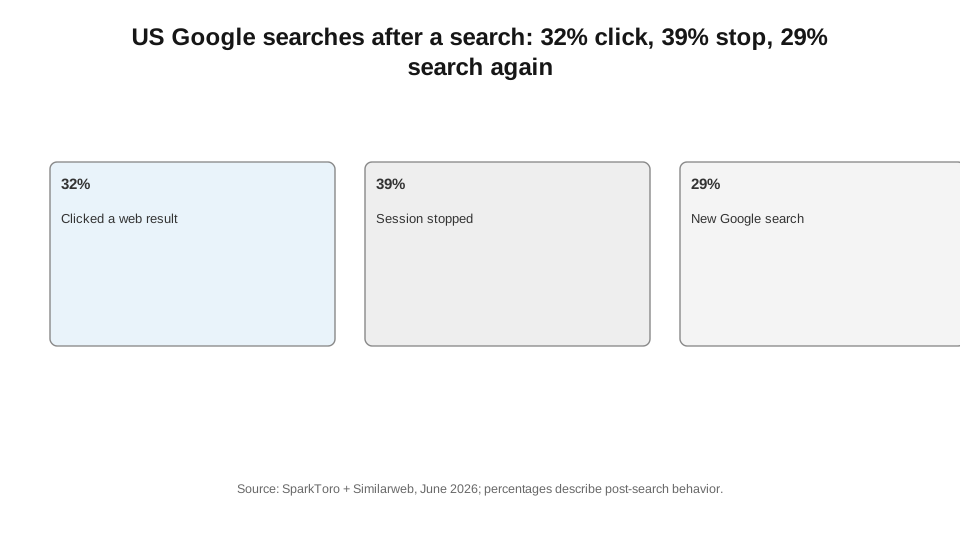
There is an important detail here that headlines usually miss. “A click occurred” does not mean “an organic click to an external site occurred.” According to SparkToro, among clicks in this panel, 66.61% went to organic results on the open web, 27.38% to Alphabet properties, and 6.01% to paid ads. In total, the study estimates around 231–232 clicks to the open web per 1,000 Google searches in the US, depending on rounding in individual tables and visualisations.[1][2]
For an SEO Lead, this is more useful in practice than the 68% figure itself. The organic click market as a whole should be understood not as “1000 searches = 1000 opportunities,” but as a sequence of losses between demand and an outbound click. Some queries are resolved immediately. Some lead to Google’s own products. Some are monetised through ads. Only then does competition between organic URLs begin.
3.4. Zero-click search depends on the country, interface and audience behaviour
Another reason not to use a single global CTR benchmark is the marked difference between countries. In June 2026, SparkToro published a comparable Similarweb snapshot for six markets over the same period. The share of searches without a click ranged from 62.1% in Germany to 69.5% in the UK.[2]
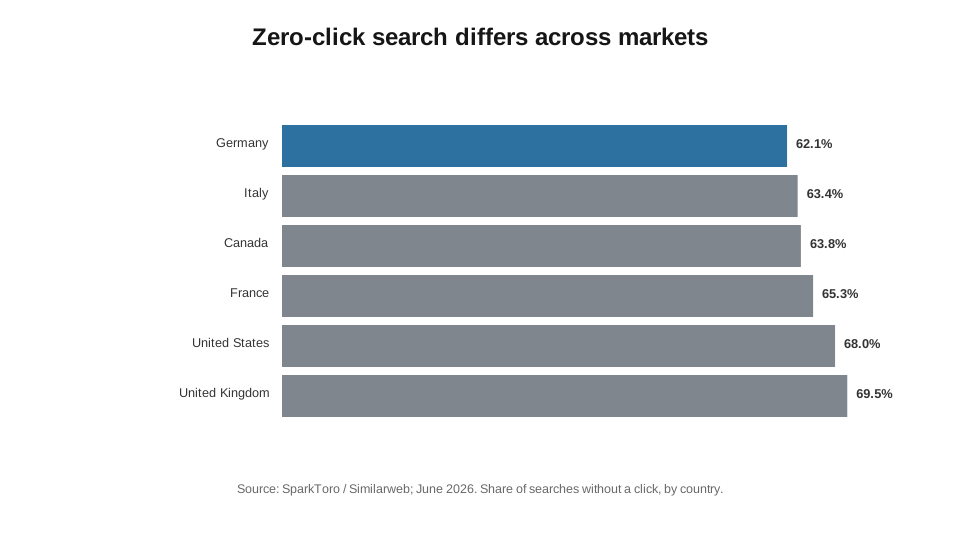
| Country | Zero-click | New search | Session ended | Clicks to the open web / 1000 |
|---|---|---|---|---|
| Germany | 62.1% | 22.5% | 39.5% | 287 |
| Italy | 63.4% | 24.7% | 38.8% | 280 |
| Canada | 63.8% | 25.6% | 38.2% | 268 |
| France | 65.3% | 22.9% | 42.3% | 271 |
| US | 68.0% | 29.0% | 39.0% | 231 |
| United Kingdom | 69.5% | 26.4% | 43.1% | 232 |
The difference in the zero-click share between Germany and the UK is 7.4 percentage points. More importantly, the study counts 287 clicks to the open web per 1,000 searches in Germany, compared with 231 in the US. That is approximately 24% more clicks to the open web for the same search volume. These data cannot establish the cause. SparkToro suggests that regulation, culture, language and interface differences may play a role, but explicitly labels these as possible explanations, not established causality.[2]
3.5. AI Overview is indeed associated with lower CTR, but the numbers need to be read correctly
The strongest independent evidence here comes from two different types of studies. Pew observed actual user behaviour. Ahrefs compared CTR across a large sample of keywords with and without AI Overview. Both approaches point in the same direction, but they answer different questions.
Pew Research Center analysed the browsing activity of 900 adults in the US. The sample included 68,879 unique Google searches in March 2025; 12,593 of them had an AI summary in the results when Pew collected the SERPs again in April. On pages with an AI summary, users clicked a traditional result in 8% of visits. Without an AI summary, the figure was 15%. A link within the AI summary itself was clicked in approximately 1% of visits. The browsing session ended after a page with an AI summary in 26% of cases, compared with 16% without one.[4]
In February 2026, Ahrefs repeated its CTR study on 300,000 keywords: 150,000 with AI Overview and 150,000 informational keywords without it. They used aggregated Google Search Console data and compared December 2023 with December 2025. After normalising for the overall decline in CTR, the presence of AI Overview correlated with an approximately 58% lower average CTR for the page in position 1.[5]
| Source | What was measured | Sample / Period | Main Result | Main Limitation |
|---|---|---|---|---|
| Pew Research Center | A real user’s next action after a Google SERP | 900 adults in the US; 68,879 searches; March 2025 | 8% clicked traditional results with an AI summary versus 15% without; 1% clicked AI summary sources | Not an experiment; the AI summary may have appeared for a different type of query. |
| Ahrefs | CTR by position for keywords with and without AI Overview | 300,000 keywords; GSC; December 2023 vs December 2025 | Estimated CTR difference of around -58% for position 1 | Groups were not randomised; search intent and SERP composition may differ. |
| Total organic click volume and “quality clicks” | Internal Google data; August 2025 | Google reported relatively stable organic click volume year over year and slightly more quality clicks | No published raw dataset or complete methodology for independent verification. |
We cannot honestly conclude from this that “AI Overview takes away exactly 58% of traffic.” Ahrefs measures an average association within a specific sample, not a universal coefficient for every query. Pew did not randomise the AI summary across identical searches either. This matters: Google shows AI answers more often for longer, question-based and informational queries, which may themselves have a lower propensity to generate clicks.[4]
3.6. Why Google can report stable clicks while publishers see declines
In August 2025, Google publicly stated that the total volume of organic clicks from Search to websites was “relatively stable” year over year, while the number of so-called quality clicks had increased slightly. By a quality click, Google means a visit after which the user does not immediately return to the results. The company also claims that AI Overviews drive more searches and display more links.[6]
This does not contradict the Ahrefs or Pew data. The aggregate market and the CTR of a specific group of queries have different denominators. If the number of searches grows while CTR per SERP falls, total click volume could theoretically remain stable. If traffic is redistributed between sites, some publishers may see declines while others grow, even when the total number of outbound clicks barely changes.
Google reported that, in major markets, AI Overviews increased Search usage by more than 10% for the types of queries on which they appear.[7] This is a usage metric, not a measure of outbound clicks. So “users are searching more” and “an individual result gets a lower CTR” can both be true at the same time.
3.7. The new economics of the click: fewer visits do not always mean less value
For a business, the click itself has never been the ultimate metric. What matters is the outcome after the click. Zero-click search makes this especially clear: if visits become less frequent, you need to look not only at CTR but also at conversion rate, revenue per session, margin, repeat visits and assisted conversions.
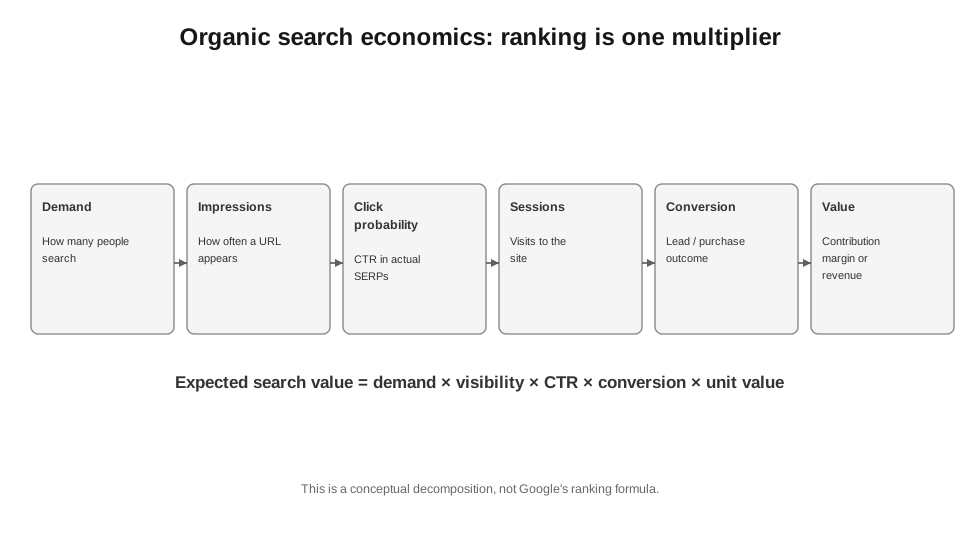
In practice, I view an organic impression as an asset with an expected value. In its simplest form: value of one impression = CTR × conversion rate × value of one conversion. This formula is not a Google model. It is a business economics model. If CTR falls by 30% but the conversion rate of those visits rises by 50%, final revenue may behave very differently from the click chart.
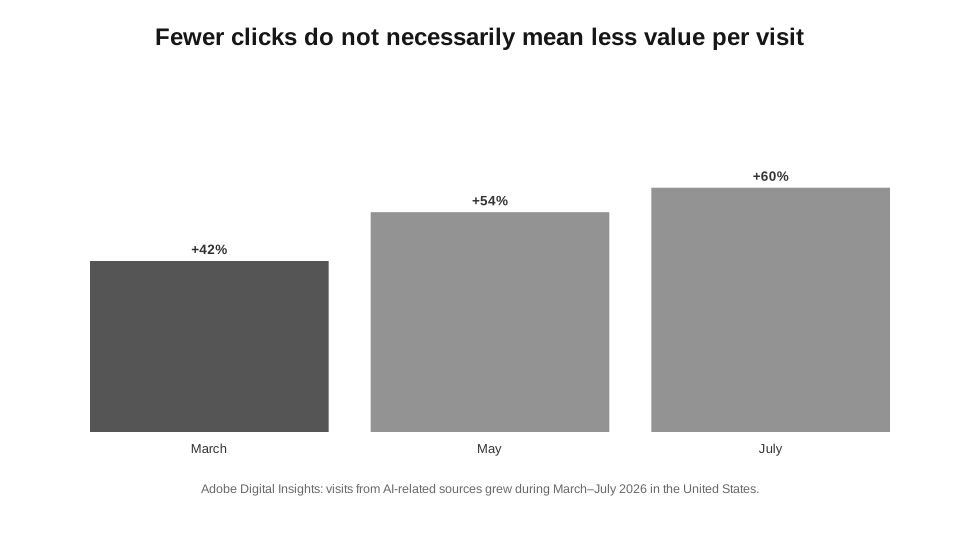
Early data suggests that some visits from AI sources do indeed carry stronger intent. Using US retail data, Adobe Digital Insights reported that visits from AI sources converted 42% better than visits from other sources in March 2026, 54% better in May and 60% better in July. This is not Google organic traffic, nor is it proof that every AI click is better. But it is a strong example of why visit volume and quality need to be measured separately.[9][10]
Similarweb estimated the average volume of visits from AI sources at approximately 770.7 million visits per month worldwide for June 2025 - May 2026, +117.4% year over year. For most sites, however, visits from AI sources still represented a low single-digit share of total traffic.[8] This illustrates the new situation well: a channel can be small in absolute terms, grow rapidly and, at the same time, have a disproportionate influence on user decisions.
3.8. How to distinguish ranking losses from CTR compression
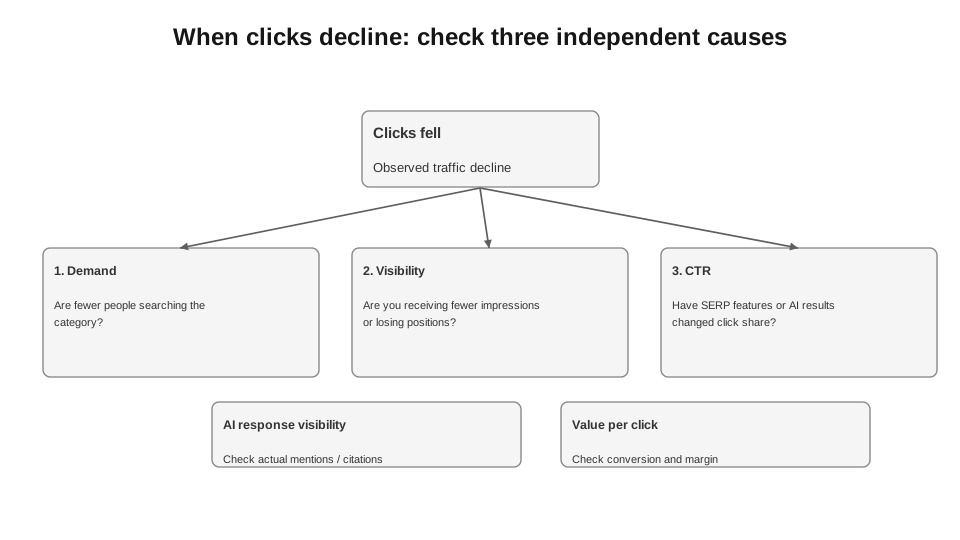
On an actual site, I do not start diagnosis by asking “has an AI Overview appeared?” I start with the basic signals. Clicks are down - what happened to impressions? If impressions are down too, the cause often lies closer to demand, seasonality, lost queries or indexing. If impressions are stable, I look at positions. If positions have worsened, it is a ranking problem. Only when impressions and positions are relatively stable, but CTR drops noticeably, do I seriously examine changes to the SERP.
| Signal in the data | What it most often means | What to check before making changes to the page |
|---|---|---|
| Clicks ↓, impressions ↓, position stable | Lower demand or a change in query mix | YoY, seasonality, country, device, branded / non-branded queries, removed SERP features. |
| Clicks ↓, impressions stable, position ↓ | Ranking loss | Competitors, Google updates, canonicalisation, indexing, backlinks, changes in query intent. |
| Clicks ↓, impressions stable, position stable, CTR ↓ | Reduced opportunity to earn a click in the SERP | AI Overview, ads, local and shopping blocks, featured snippets, changes to the title or snippet. |
| Clicks ↓, AI impressions ↑ | Possible visibility without a visit | generative AI report in GSC, pages, countries, devices; compare with the standard performance report. |
| Clicks ↓, conversions stable or ↑ | Change in traffic quality | CVR, revenue per session, margin, growth in branded demand, assisted conversions. |
3.9. What you can actually measure in Google Search Console in 2026
In the standard Google Search Console Performance report, we have clicks, impressions, CTR and average position. Google defines CTR simply as clicks / impressions, and average position as the average topmost position of a result from the site or URL, depending on the aggregation.[12] This is enough to identify pages and queries where click yield is falling without an obvious loss of visibility.
Starting on August 31, 2026, Google rolled out a separate generative AI performance report for all sites. It shows impressions in AI Overviews and AI Mode and allows them to be grouped by page, country, date and device. But this report has no separate clicks, CTR, position or query dimension.[11] So we can see that a page is gaining AI visibility, but we cannot calculate “AI Overview CTR” or identify the exact query directly from GSC.
Another operational limitation: as of September 2026, the generative AI report can be exported via the Export button, but is not included in the standard Search Console API or bulk export to BigQuery. BigQuery is available for the standard performance report and remains the most convenient way to compare CTR, positions and impressions at scale.[11][13]
3.10. SQL: finding candidates for “click compression”, not just pages with declining traffic
For a large site, I start with URLs where impressions have not fallen substantially and average position has not worsened substantially, but CTR and clicks have dropped. This does not prove an AI Overview effect. It is simply a shortlist of pages where it makes sense to check the SERP and the generative AI report manually.
NO CODE: AI PROMPT
I will upload two CSV files from Google Search Console for two consecutive 28-day periods at page level. Check the column names and do not invent missing data. Match URLs across the periods and calculate the changes in impressions, clicks, CTR and average position. List URLs with at least 1,000 impressions in both periods, where impressions changed by no more than 10%, position by no more than 0.5, and CTR fell by at least 20%. Sort by the largest drop in clicks and explain that these are only candidates for a manual SERP review, not proof of an AI effect.
ALTERNATIVE WITHOUT AI
In Google Sheets/Excel, combine the two exports using XLOOKUP or Power Query, calculate the relative changes in impressions, clicks and CTR and the absolute change in position, then apply the same filters. For a complete bulk export without a row limit, SQL remains more reliable.
QR: CODE
Scan with your camera: the QR code contains a compact executable version of the code without comments. The commented code is provided below.
FOR AUTOMATION: SQL FOR BIGQUERY
CODE 3.1. The query uses the official Search Console bulk export schema. The thresholds of 10%, 0.5 positions and -20% CTR are practical filters for initial diagnosis, not universal standards.
-- Task: Find URLs where visibility has barely changed,
-- but CTR has dropped significantly. These are candidates for manual SERP inspection.
-- Replace YOUR_PROJECT.searchconsole with your GSC bulk export dataset.
WITH base AS (
 SELECT
 url,
 -- Divide the 56 days into two adjacent 28-day periods.
 CASE
 WHEN data_date BETWEEN DATE_SUB(CURRENT_DATE(), INTERVAL 28 DAY)
 AND DATE_SUB(CURRENT_DATE(), INTERVAL 1 DAY)
 THEN 'current'
 WHEN data_date BETWEEN DATE_SUB(CURRENT_DATE(), INTERVAL 56 DAY)
 AND DATE_SUB(CURRENT_DATE(), INTERVAL 29 DAY)
 THEN 'previous'
 END AS period,
 -- Aggregate the basic metrics by URL and period.
 SUM(impressions) AS impressions,
 SUM(clicks) AS clicks,
 SAFE_DIVIDE(SUM(clicks), SUM(impressions)) AS ctr,
 -- In GSC bulk export, position is stored as sum_position.
 SAFE_DIVIDE(SUM(sum_position), SUM(impressions)) + 1 AS avg_position
 FROM `YOUR_PROJECT.searchconsole.searchdata_url_impression`
 WHERE search_type = 'WEB'
 AND data_date BETWEEN DATE_SUB(CURRENT_DATE(), INTERVAL 56 DAY)
 AND DATE_SUB(CURRENT_DATE(), INTERVAL 1 DAY)
 GROUP BY url, period
),
p AS (
 SELECT
 url,
 -- We decompose the two periods into separate columns.
 MAX(IF(period='current', impressions, NULL)) AS imp_cur,
 MAX(IF(period='previous', impressions, NULL)) AS imp_prev,
 MAX(IF(period='current', clicks, NULL)) AS clicks_cur,
 MAX(IF(period='previous', clicks, NULL)) AS clicks_prev,
 MAX(IF(period='current', ctr, NULL)) AS ctr_cur,
 MAX(IF(period='previous', ctr, NULL)) AS ctr_prev,
 MAX(IF(period='current', avg_position, NULL)) AS pos_cur,
 MAX(IF(period='previous', avg_position, NULL)) AS pos_prev
 FROM base
 GROUP BY url
)
SELECT
 *,
 -- Relative change in impressions, clicks and CTR; position is the absolute difference.
 SAFE_DIVIDE(imp_cur - imp_prev, imp_prev) AS impressions_change,
 SAFE_DIVIDE(clicks_cur - clicks_prev, clicks_prev) AS clicks_change,
 SAFE_DIVIDE(ctr_cur - ctr_prev, ctr_prev) AS ctr_change,
 pos_cur - pos_prev AS position_changeFROM p
WHERE imp_cur >= 1000
 AND imp_prev >= 1000
 -- Impressions are roughly stable: +/-10%.
 AND ABS(SAFE_DIVIDE(imp_cur - imp_prev, imp_prev)) <= 0.10
 -- Average position has changed by no more than 0.5.
 AND ABS(pos_cur - pos_prev) <= 0.5
 -- CTR has dropped by at least 20%.
 AND SAFE_DIVIDE(ctr_cur - ctr_prev, ctr_prev) <= -0.20
ORDER BY clicks_change ASC;
Two things are critical in this SQL. First, average position for a URL is calculated using SUM(sum_position) / SUM(impressions) + 1, as Google describes. Second, the data must be aggregated using SUM, because Google explicitly warns that bulk export rows are not guaranteed to be consolidated by date, URL or query.[13]
Next, I take 20-50 URLs with the largest drop in CTR and manually examine the SERP, SERP feature history in a third-party tool, AI impressions, the device breakdown and the query mix. The SQL itself does not say “AI is to blame”. It filters out thousands of pages where the cause is clearly something else.
3.11. Different business models pay a different price for zero-click search
For a publisher, zero-click search often directly hurts monetisation, because the business earns revenue from page views, advertising or subscriptions following a visit. For an online store, the situation is different: a user may get a brief comparison in Google Search, but still has to visit a site or marketplace to make a purchase. For a local business, some valuable actions happen entirely within Google: a call, directions, a booking. For an affiliate site, value depends particularly on the page type: an informational need may be fully satisfied in the SERP, while comparison or bonus intent still requires a click-through if the user wants to check the terms or complete a transaction.
| Model | What Zero-Click Squeezes the Most | What I Put Next to Clicks |
|---|---|---|
| Publisher / media outlet | Page views and ad impressions | Returning users, direct visits, newsletter, branded search, revenue per visitor. |
| Affiliate site | Click-throughs from informational and some comparison queries | EPC, conversion to advertiser click-through, commercial page CTR, branded demand. |
| Online store | Top of the funnel and part of product research | Revenue, CVR, assisted conversions, share of branded and non-branded queries, product page visits. |
| Local business | A website visit may not happen at all | Calls, directions, bookings, profile interactions, local conversions. |
| SaaS / lead generation | Some educational queries | Demo or sign-up rate, sales funnel, branded search, assisted conversions, return visits. |
That is why I do not support the idea of simply “replacing traffic with visibility”. For media businesses, traffic may remain the main economic unit. For an online store, revenue matters more than sessions. For a brand without a direct online transaction, branded demand and delayed conversions matter more. The right metric is determined by the business model, not by an SEO buzzword.
3.12. A 60-minute audit of declining organic clicks
This audit is not intended to deliver a final conclusion, but an initial diagnosis. In an hour, I want to understand where to dig: demand, rankings, the SERP or traffic quality. If the team still cannot formulate a hypothesis in one sentence after this, there is not enough data.
| Time | What we do | What should be the result |
|---|---|---|
| 0-10 min | GSC: 28 days versus the previous 28, plus a year-over-year comparison. Break down clicks, impressions, CTR and position by country and device. | Establish whether demand, visibility or click yield has declined. |
| 10-20 min | Branded / non-branded queries and the main query clusters. | Has the demand mix itself changed? |
| 20-35 min | 20-50 URLs with stable impressions and positions, but lower CTR. | Candidates for CTR compression in the SERP. |
| 35-45 min | Check SERP features and the AI Overview for key queries; review historical data where available. | What exactly has appeared between the URL and the user? |
| 45-55 min | Generative AI report: pages, countries, devices; compare with the standard performance report. | Is AI visibility growing on pages with declining CTR? |
| 55-60 min | GA4 / CRM / revenue: CVR, revenue per organic session, margin. | Has the decline in clicks actually worsened business outcomes? |
3.13. What we know for certain and what remains a hypothesis
We know for certain that zero-click searches account for the majority of Google searches in large user behaviour studies from 2024-2026, although the exact percentage depends on the panel, country and methodology.[1][2][3] We know for certain that in the Pew study, users clicked on standard results less often when an AI summary was present on the page, and hardly ever clicked on sources within the AI summary.[4] We know that Ahrefs found a strong negative association between AI Overview and the CTR of top-ranking pages in a large sample.[5]
We also know that Google publicly claims relatively stable overall organic click volume and higher quality for some clicks, but does not publish a raw dataset that would allow this conclusion to be independently reproduced.[6] This must be presented specifically as Google's claim, not as a fact established by external research.
We do not know a universal “AI CTR penalty” for any given URL. We do not know how many lost direct clicks return later through branded search, a direct visit or another channel. We cannot calculate AI Overview CTR directly from GSC in 2026, because the separate generative AI report shows impressions but does not provide separate clicks and queries.[11]
So a sound strategy does not begin with fighting zero-click search. It begins with understanding exactly where the business makes money. If a site monetises every page view, CTR compression is a critical risk. If organic search generates demand that converts later, you need to be able to measure this delayed effect. And if clicks become less frequent but convert better, the KPI should show that, rather than simply display a red arrow next to sessions.
In the next Chapter, I will examine precisely this level: what visibility without a click means, which forms of it can actually be measured and where metrics that look attractive but lack a reliable denominator begin.
Chapter sources
1. SparkToro. In 2026, Less than One Third of Google Searches Still Send a Click. https://sparktoro.com/blog/in-2026-less-than-one-third-of-google-searches-still-send-a-click/ Similarweb mobile and desktop panel, US, January-April 2026; 68.01% zero-click searches; methodology and limitations.
2. SparkToro. Zero-Click Searches: Highest in the UK, Lowest in Germany, and France has the Most Efficient Searchers. https://sparktoro.com/blog/zero-click-searches-highest-in-the-uk-lowest-in-germany-and-france-has-the-most-efficient-searchers/ Comparison of six countries using Similarweb data, including the share of zero-click searches and clicks to the open web per 1,000 searches.
3. SparkToro. 2024 Zero-Click Search Study. https://sparktoro.com/blog/2024-zero-click-search-study-for-every-1000-us-google-searches-only-374-clicks-go-to-the-open-web-in-the-eu-its-360/ Datos behavioural data panel; US and EU; 2024. Used for historical context with a caveat about differing panels.
4. Pew Research Center. Google users are less likely to click on links when an AI summary appears in the results. https://www.pewresearch.org/short-reads/2025/07/22/google-users-are-less-likely-to-click-on-links-when-an-ai-summary-appears-in-the-results/ 900 US adults, 68,879 unique Google searches; behaviour after SERPs with and without an AI summary.
5. Ahrefs. Update: AI Overviews Reduce Clicks by 58%. https://ahrefs.com/blog/ai-overviews-reduce-clicks-update/ 300,000 keywords; GSC; CTR comparison for SERPs with and without an AI Overview.
6. Google. AI in Search is driving more queries and higher quality clicks. https://blog.google/products-and-platforms/products/search/ai-search-driving-more-queries-higher-quality-clicks/ Google's official position on aggregate organic clicks and their quality. Internal Google data without a published raw dataset.
7. Google. AI in Search: Going beyond information to intelligence / AI Overviews expansion. https://blog.google/products-and-platforms/products/search/google-search-ai-mode-update/ Google's claim of over 10% growth in usage for query types where AI Overviews appear.
8. Similarweb. AI Referral Traffic by Industry: What 770 Million Monthly Visits Reveal. https://aisearch.similarweb.com/blog/ai-referral-traffic-by-industry/ 770.7 million average monthly visits from AI sources, June 2025 - May 2026; +117.4% year over year.
9. Adobe. AI traffic grows but retail sites lag in AI search visibility. https://business.adobe.com/uk/blog/ai-traffic-surge-retail-sites-not-machine-readable March 2026: visits from AI sources to US retail sites converted 42% better than other visits.
10. Adobe. How AI is reshaping travel planning / retail update. https://business.adobe.com/blog/us-consumers-are-embracing-llms-to-make-travel-plans July 2026: visits from AI sources to US retail sites converted 60% better; engagement and bounce metrics.
11. Google Search Console Help. Generative AI performance report (Search). https://support.google.com/webmasters/answer/16984139?hl=en Separate generative AI impressions for AI Overviews and AI Mode; dimensions, limitations, export.
12. Google Search Console Help. What are impressions, position, and clicks? https://support.google.com/webmasters/answer/7042828?hl=en Official definitions of impressions, clicks, CTR and position.
13. Google Search Console Help. Query guidelines and sample queries / Table guidelines and reference. https://support.google.com/webmasters/answer/12917174?hl=en Official bulk export schema for BigQuery, aggregation, SUM(impressions), SUM(clicks), sum_position and SQL examples.